
Unsurpassed Visibility
AutoMapa #geoanalytics takes data visibility to the next level, providing timely and accurate insights for informed, data-driven decisions. This will allow you to optimize operations and maintain a competitive edge.

AutoMapa #geoanalytics
is a comprehensive software platform for spatial analysis and mapping that integrates advanced geospatial data processing, visualization, analytical capabilities with rich proprietary maps and data layers, enabling users to create, manage, and interpret complex information with location context.

Unlimited Layers
You can easily arrange multiple data layers and create a map view that exactly suits your needs.
Arranging visible layers and transparency adjustment
Rich library of complementary map layers and data sets
Customizable map background
Versatile Data Collections
You can integrate many data sources and use various location data types and unlimited meta data associated with each location.
Points - specific locations with no area, such as markets or ATMs
Lines - linear features with length but no area, such as routes, utility lines or GPS tracks
Polygons - areas with defined boundaries, such as service territories or zipcode areas
Mesh - set of polygons that share edges and vertices, so there are no gaps or overlaps between them
Unified Grids - data structure that divides mapped area into equal-sized, regularly spaced cells (squares or hexagons), creating a standardized framework for organizing, managing, and analyzing spatial information


Smart Filters
Filters allow you to precisely select and extract data by applying multiple variable settings.
Multiple filters on complex data sets with user-friendly UI
Time series analysis and trend-based filters
Human readable filter description
Collabration tools for sharing filters with other users other user groups
Color Coding
Color Coding - helps visualize different data points and trends within your spatial data collection.
Coloring on metadata and time series (trends)
Automatic range and statistical wizards for distribution analysis
Customizable colors

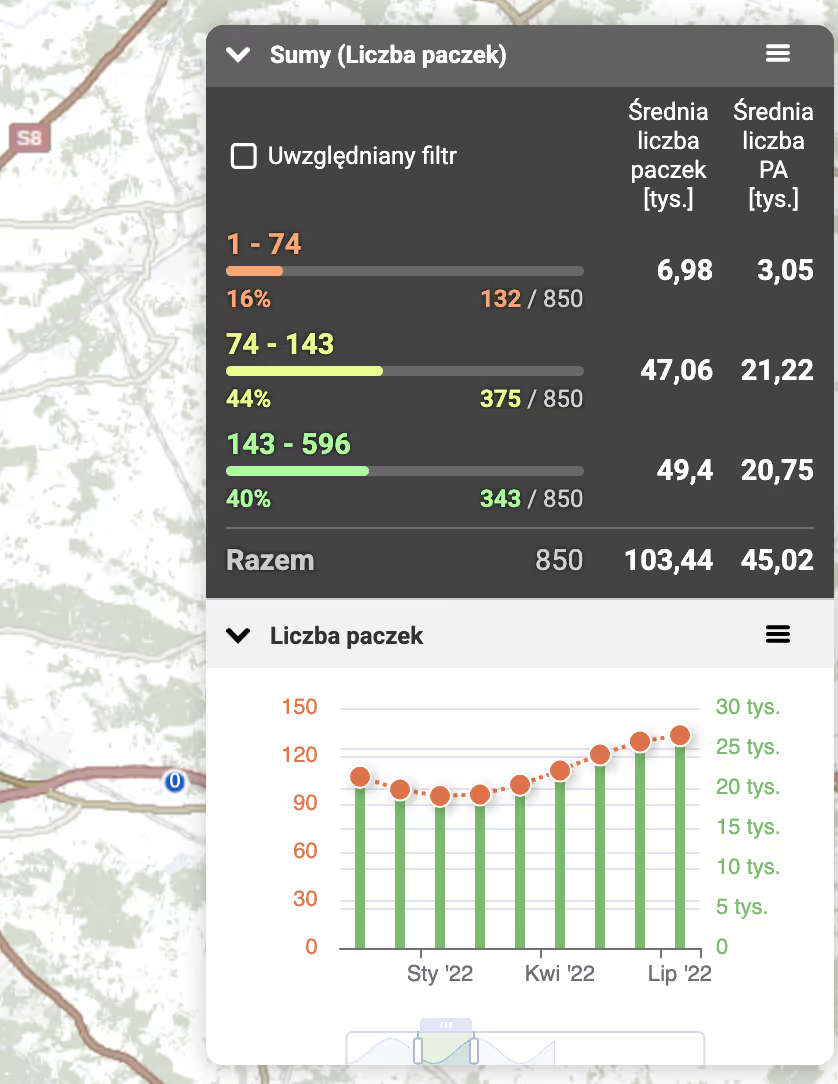
Data Radar
The Radar - instantly summarizes data based on your current Smart Filters and Color Coding settings.
Quick summary of the data with and without filtering, divided into color coding categories
Dynamic graphs supporting time series and trend data
Instant update when filters or color coing are modified
Dashboards, Reports and Collaboration Tools
Spatial Dashboards - offer interactive reports to share insights with your team.
Easy creation of interactive reports
Multi-modal catchment areas
Competition coverage mapping and traffic generators detection
Intuitive sharing functions

With AutoMapa #geoanalytics, I reduced time-consuming expansion analyses - demographic and volumetric - to just a few clicks. Brilliant!

Unlock Potential of Your Data
Ready to elevate your business with precise spatial analytics? Contact us now for a personalised consultation or a live demo to see how our solutions can drive your success.
